Investigating silent backend degradation using flow-level observability

Exploring DevOps tools and practices.
Kubernetes is very good at telling you when something is down.
It's much less useful at telling you when something is quietly getting worse.
There's a class of failure where a backend is still running, still passing every readiness probe, still serving requests—and yet every response takes hundreds of milliseconds longer than it should. Nothing crashes. Nothing restarts. Every health signal stays green.
From Kubernetes' perspective, nothing is wrong.
From your users' perspective, everything feels slower.
This article explores that failure mode on a real Amazon EKS cluster running Cilium in overlay (BYOCNI) mode with kube-proxy replacement enabled and Hubble for flow observability. The goal wasn't to benchmark Hubble or compare features. It was to answer a practical question:
If one backend behind a Service silently becomes slow, how difficult is it to identify the problem using standard Kubernetes tooling—and what changes when you have flow-level visibility?
The setup
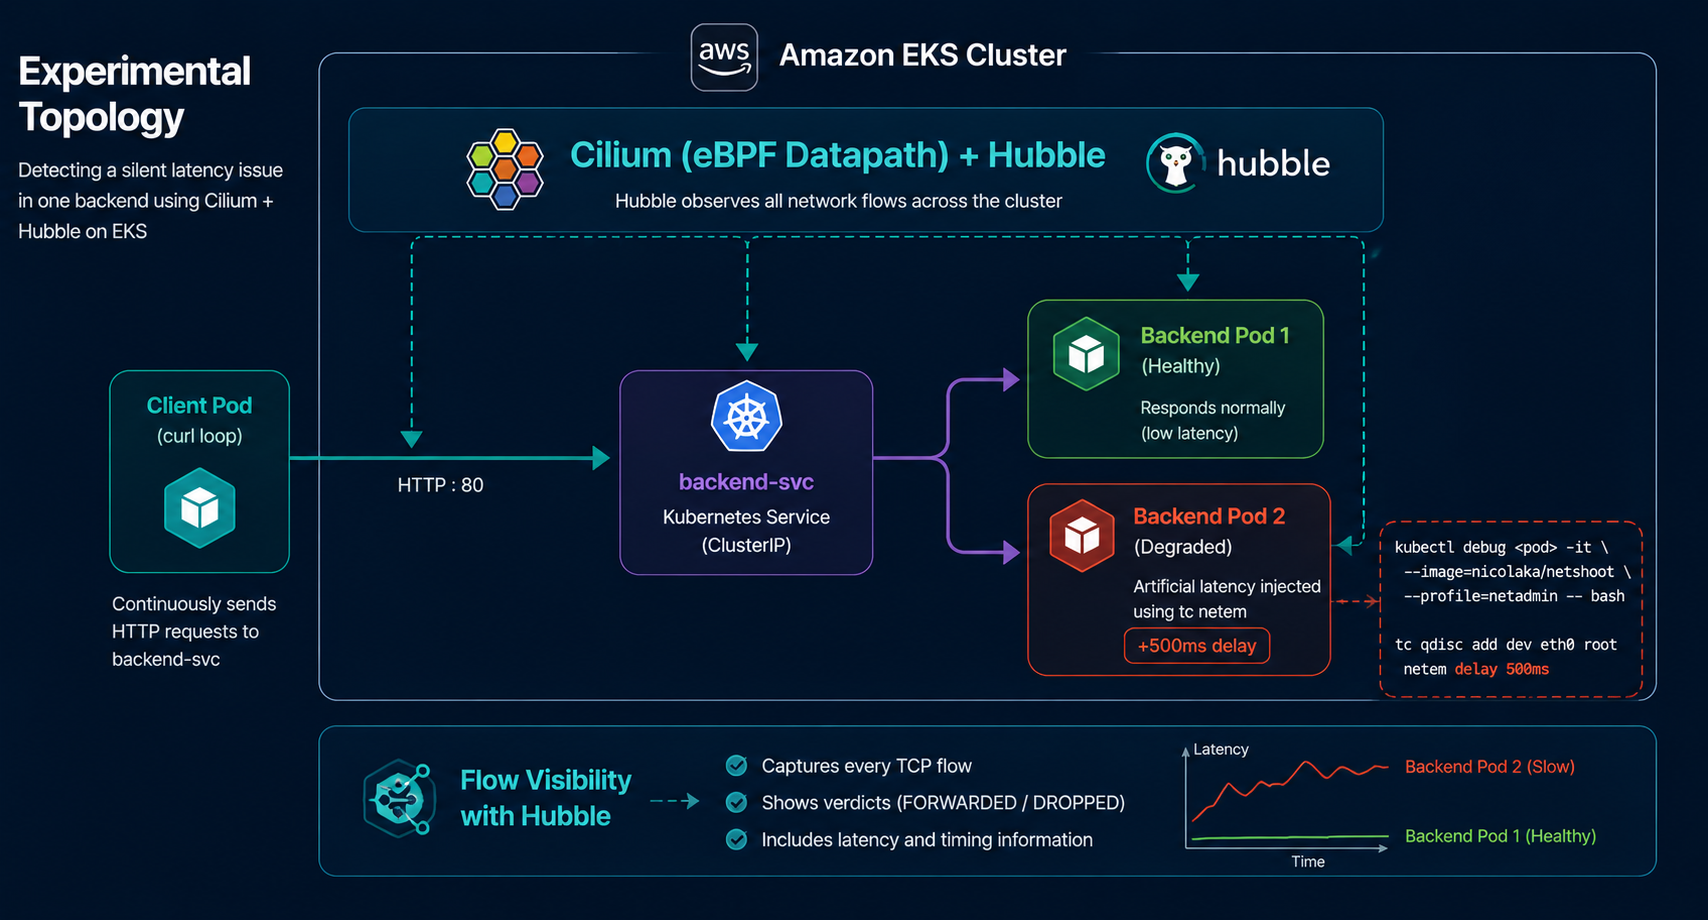
The cluster consists of:
Amazon EKS
Cilium as the CNI in overlay (BYOCNI) mode
kube-proxy replacement enabled
Hubble enabled for flow observability
I'm intentionally skipping installation and configuration because that's a separate topic. The important detail is that Hubble continuously observes every network flow that passes through Cilium's eBPF datapath. It isn't something you start after a problem appears—it is already collecting flow information before anyone begins investigating.
For the workload itself, I deployed:
a
backend-svcServicetwo backend replicas
a client pod continuously sending requests
One backend would remain healthy.
The other would be deliberately slowed down.
Creating a "healthy but slow" backend
Instead of modifying the application, I injected latency directly into the pod's network interface using Linux traffic control (tc).
kubectl debug -n fixtures <backend-pod> -it \
  --image=nicolaka/netshoot \
  --profile=netadmin -- bash

tc qdisc add dev eth0 root netem delay 500ms
Immediately afterwards, the pod was still:
Running
Ready
Serving requests
Nothing in Kubernetes considered it unhealthy.
A quick request confirmed the added latency:
curl -s -o /dev/null -w "time_total: %{time_total}s\n" http://<backend-pod-ip>:80/
time_total: 1.502870s

The backend wasn't failing.
It was simply slower.
And that's exactly the kind of degradation traditional health checks are not designed to detect.
Readiness probes answer one question:
Can this pod safely receive traffic?
They do not answer questions like:
Is one replica much slower than another?
Has network latency suddenly increased?
Is every request taking longer than expected?
Is traffic being delayed somewhere below the application?
The pod remained perfectly "healthy" according to Kubernetes because the application itself was functioning correctly.
Following the traditional investigation
With latency confirmed, the next step was the same one many Kubernetes engineers would take.
Start with the pod.
kubectl -n fixtures get pods -l app=backend

kubectl -n fixtures describe pod <backend-pod> | tail -15

kubectl -n fixtures logs <backend-pod> --tail=20
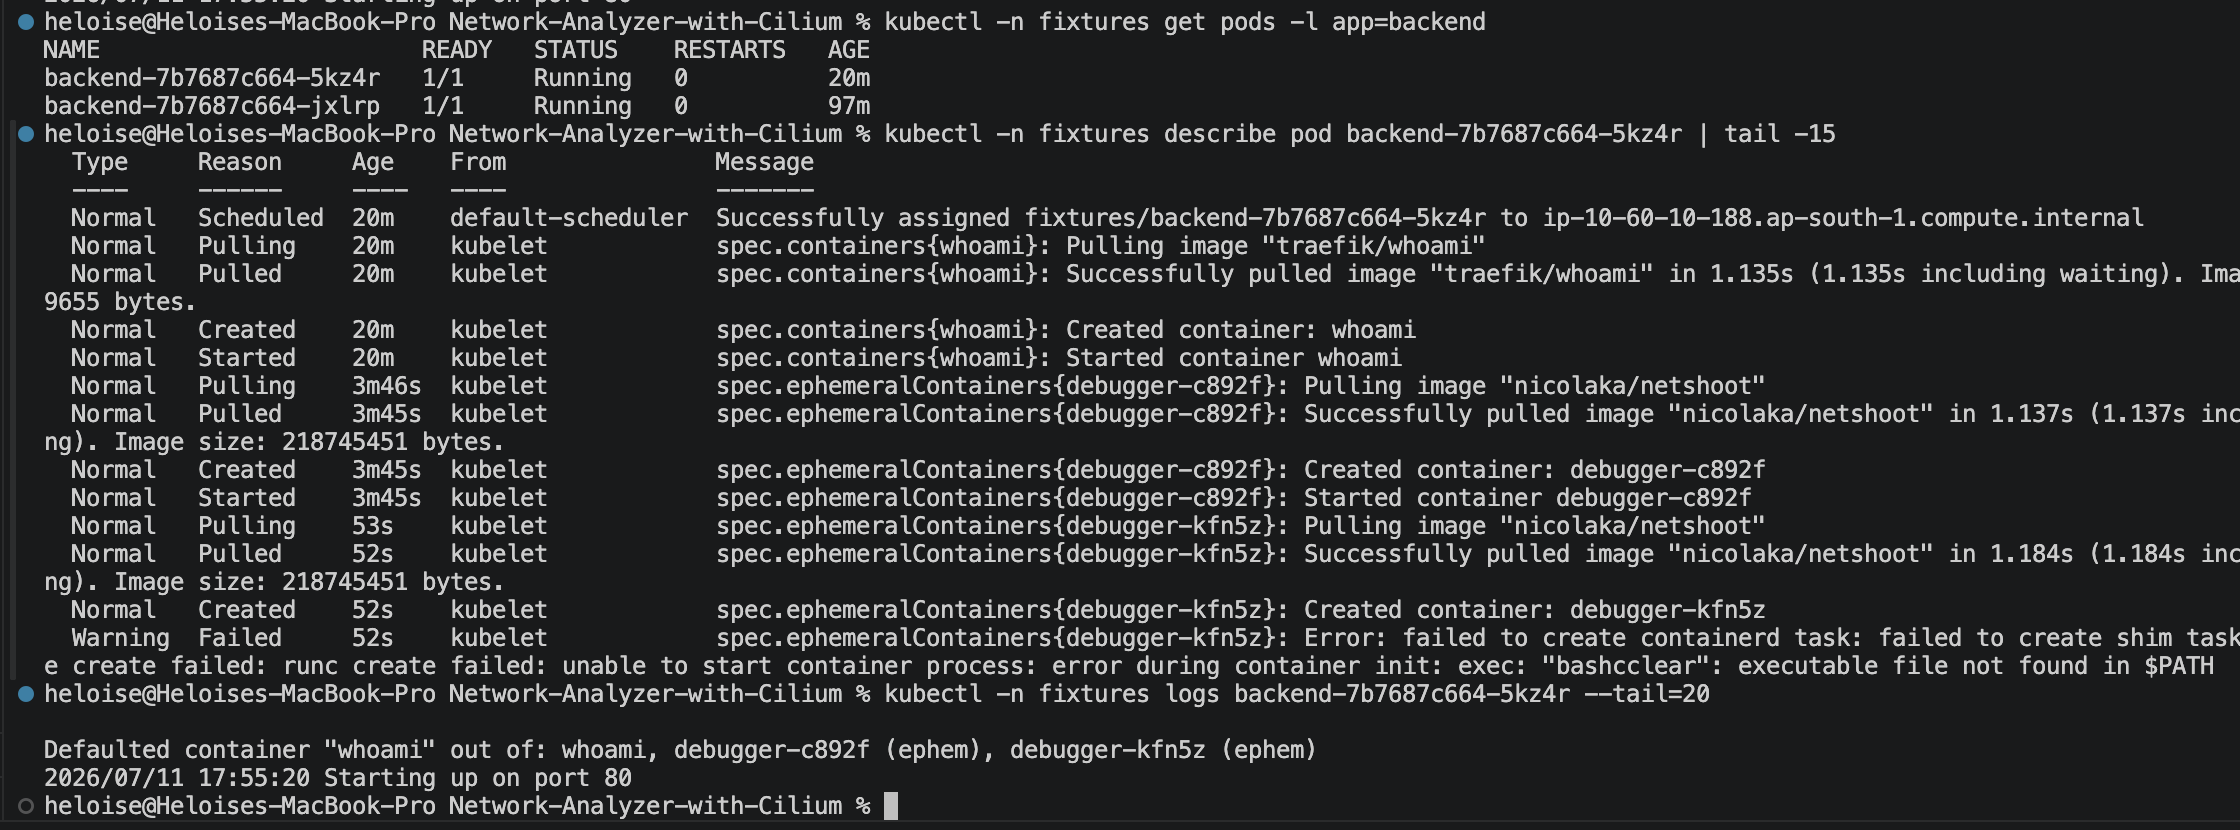
Everything looked normal.
Running
Ready
Zero restarts
No errors in the logs
None of those results were surprising.
The application wasn't broken.
The network path underneath it was.
In many production environments, application or Prometheus metrics would likely tell you that latency has increased. Those metrics are invaluable for detecting that a problem exists.
But they often don't explain where the delay is occurring.
Once you've narrowed the investigation to networking, traditional tooling usually means packet capture.
tcpdump -i eth0 -tttt host 10.0.1.12 and port 80
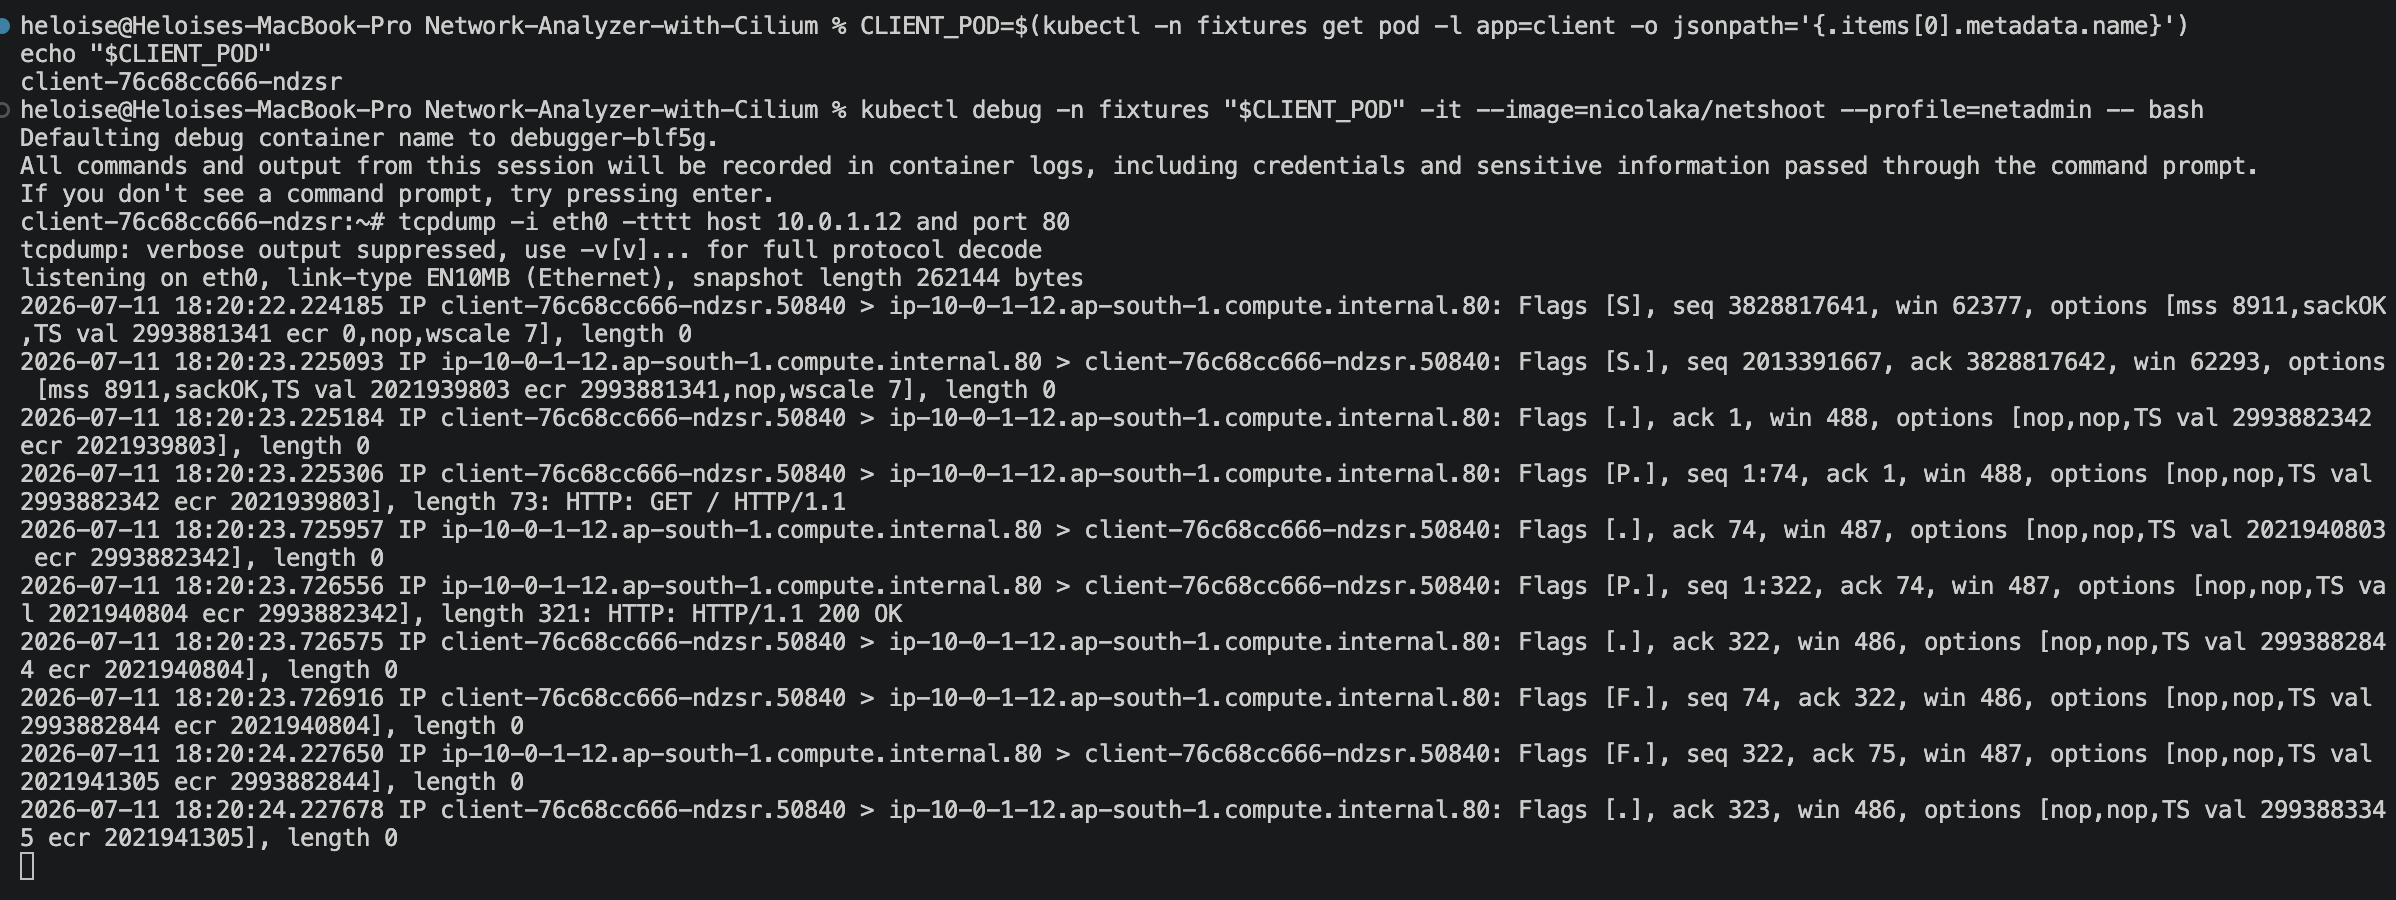
Packet capture absolutely works.
But for this investigation it comes with several costs.
The output contains IP addresses, ports and timestamps—not Kubernetes objects.
To identify where the delay occurred, you'd typically capture traffic on both the client and backend, export the captures, open them in Wireshark, and manually correlate packets using timestamps and sequence numbers.
It also assumes you've already identified the right pods to capture from.
Packet capture remains the right tool for many low-level networking problems such as retransmissions, window sizing or packet analysis.
But answering a simple question—
Which backend became slow?
—requires considerably more manual work than most engineers would like.
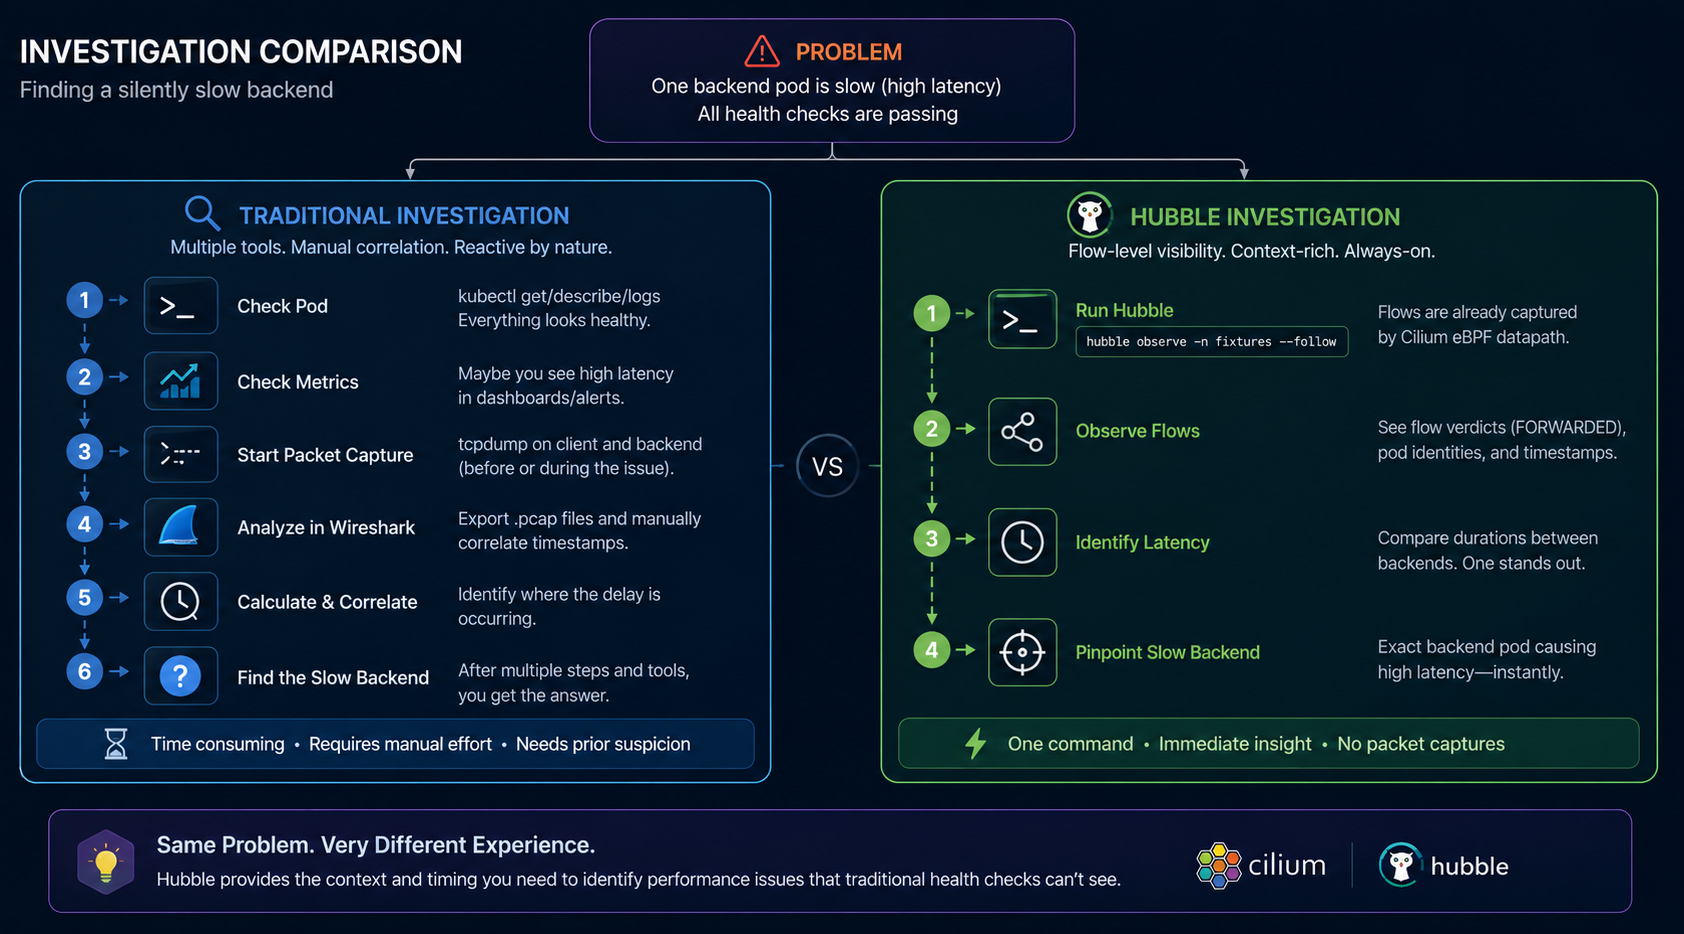
Where Hubble changes the investigation
Because Hubble continuously observes traffic flowing through Cilium's eBPF datapath, there was no need to start collecting evidence after the slowdown occurred.
The investigation began with a single command:
hubble observe --namespace fixtures --follow
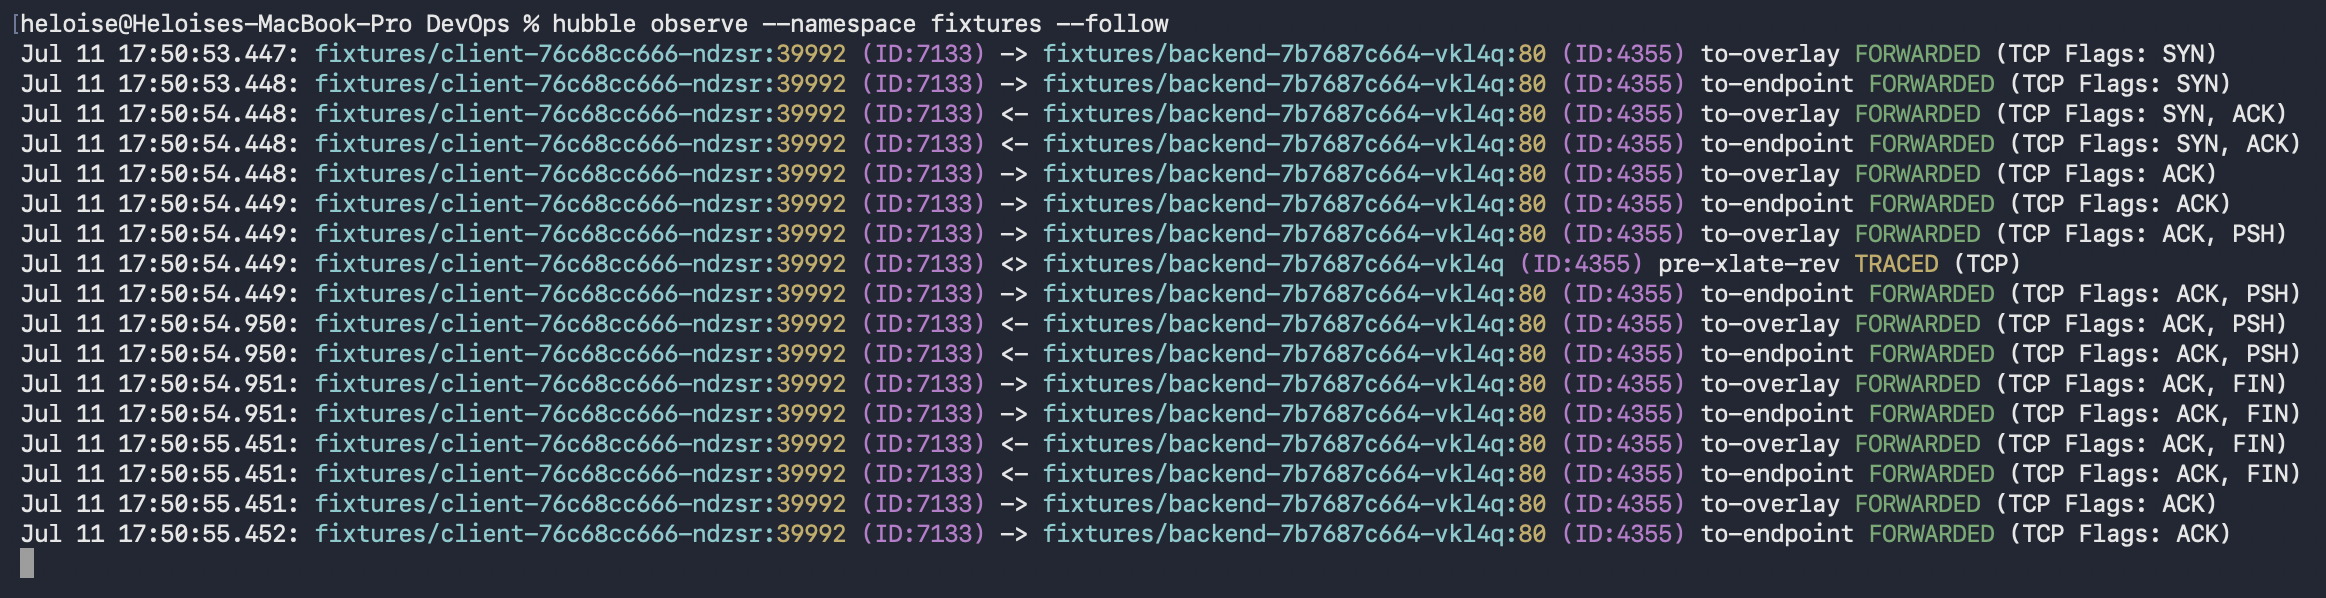
The flows immediately showed something interesting.
Every connection was marked as:
FORWARDED
Nothing was being dropped.
Nothing was timing out.
Connectivity was healthy.
The timestamps, however, told a different story.
Requests left the client almost immediately.
Responses coming back from one backend consistently arrived hundreds of milliseconds later than expected.
Comparing those flows against a normal exchange—such as a DNS lookup completing in only a few milliseconds—made the degraded backend obvious.
No packet capture.
No Wireshark.
No manual timestamp correlation.
For this class of problem, flow-level observability reduced the investigation to a single continuously available data source.
That isn't because Hubble replaces tools like tcpdump.
It doesn't.
Packet capture is still essential when you need payloads, retransmissions or protocol-level details.
Instead, Hubble answers a different question:
How is traffic flowing through the cluster right now?
For identifying a silently degraded backend, that turned out to be exactly the information I needed.
Turning the investigation into a tool
Running a single command is useful once.
The obvious next question was whether the investigation could be automated.
I built a small proof-of-concept script—around 150 lines—that performs two checks.
First, it verifies that the Service has ready endpoints using the Kubernetes API.
This step matters because, under Cilium's Socket Load Balancer, a Service with zero endpoints is rejected before any packet is created. Since no network flow exists, Hubble has nothing to observe. That's a limitation of where the packet is intercepted—not a limitation of Hubble itself.
Only after confirming endpoints exist does the script inspect recent TCP flows collected from Hubble.
Connections whose total duration exceeds a configurable threshold are reported as degraded.
python3 analyzer.py check \
  --namespace fixtures \
  --service backend-svc \
  --port 80

After injecting the same 500 ms delay:

The implementation itself isn't the interesting part.
The important observation is that flow telemetry can be turned into automated diagnostics rather than remaining something an engineer manually inspects during an incident.
What this demonstrates
This experiment isn't an argument that Kubernetes health checks are broken.
They're doing exactly what they were designed to do.
The backend really was healthy.
The application really was serving requests.
The failure existed somewhere Kubernetes was never intended to observe.
Flow-level observability fills that gap.
It doesn't replace readiness probes, Prometheus metrics or packet capture.
It complements them by answering a different question:
Not just "Is traffic flowing?" but "How is it flowing?"
For this particular class of failure—a backend that's healthy enough to stay in rotation but slow enough to degrade user experience—that difference turned out to be the entire investigation.


