EFK on EKS: 4 Configuration Decisions That Prevent Production Failures

This is a companion to my previous article on inheriting and fixing a broken EFK stack. That article focused on what breaks in production. This one focuses on the configuration decisions that prevent those failures in the first place.
Most EFK guides do a great job of getting the stack up and running.
This article focuses on a different part of the journey: understanding the configuration decisions that shape reliability, scalability, and operability in production.
Logging systems rarely fail during installation. They fail during downstream outages, node pressure, restarts, traffic spikes, and configuration mismatches between components.
While building this stack on EKS, I ran into four non-obvious issues:
Elasticsearch stuck at
0/1 Runningbecause TLS was only partially disabledFluent Bit getting OOMKilled during downstream failures
Logs duplicated across indices due to incorrect routing
Kibana UI breaking because of Elasticsearch 8.x compatibility issues
This article focuses on the configuration decisions that fixed those issues.
Rather than dumping configuration files, I want to explain why each setting exists, what breaks without it, and how to reason about these systems in production.
GitHub Repository
All manifests, Helm values, Fluent Bit configs, Elasticsearch templates, and ILM policies used in this article are available here GitHub Repo
Architecture
The goal was not simply “get logs into Kibana.”
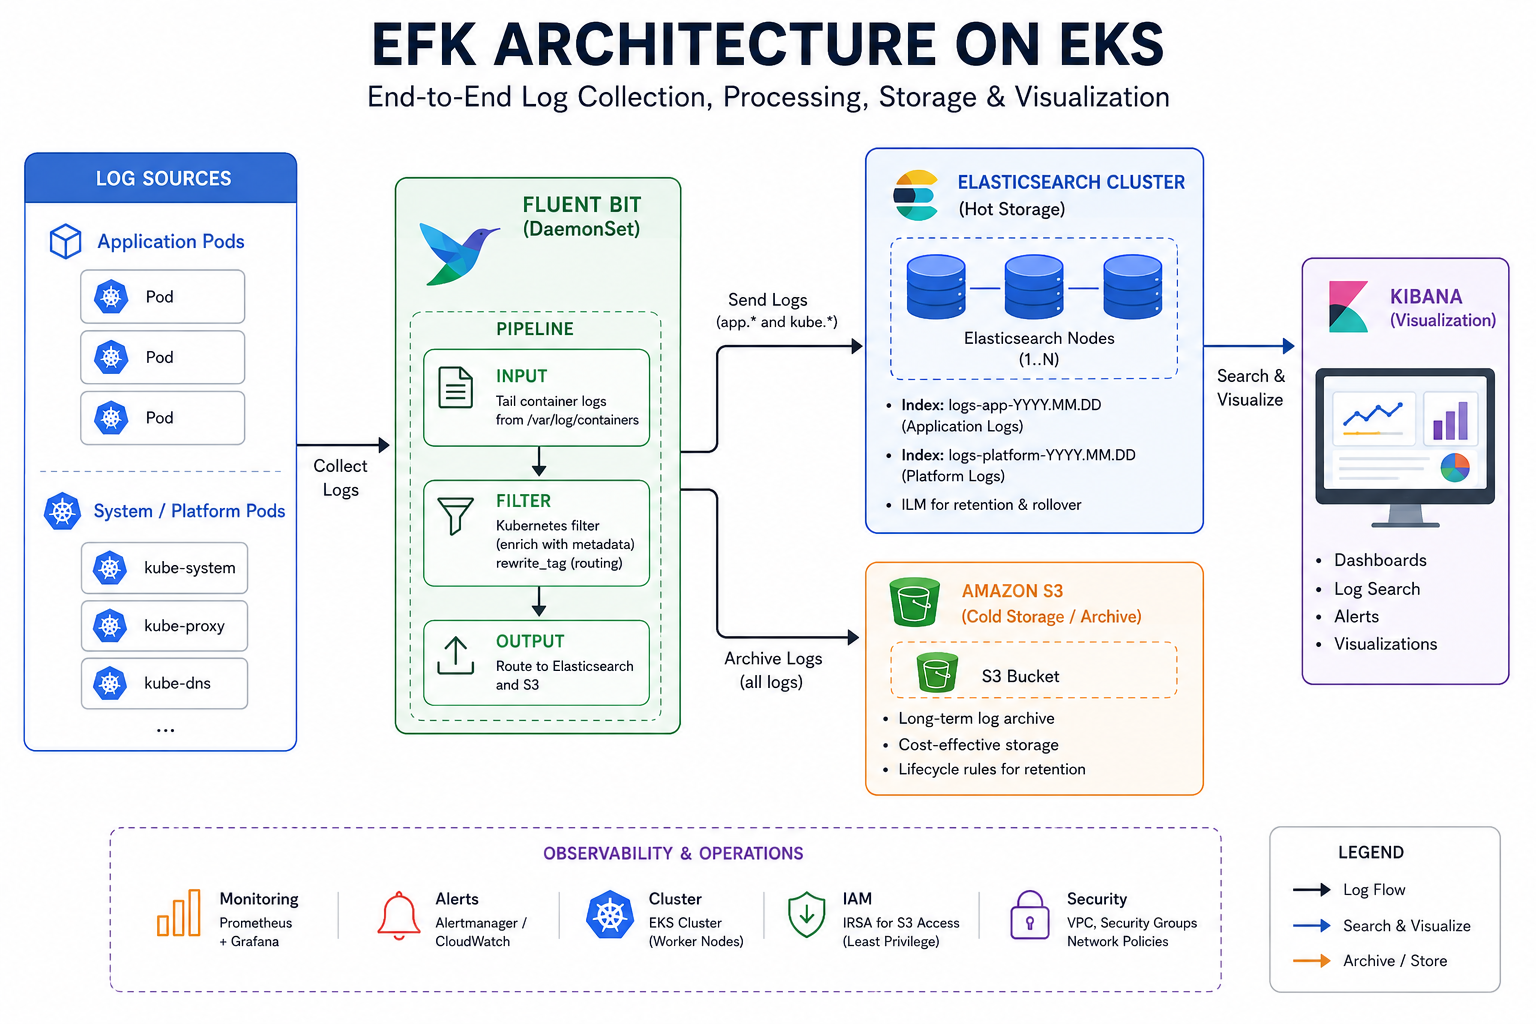
The system needed to support:
Clean separation between application and platform logs
Fast search for recent logs
Long-term archival in S3
Graceful degradation during downstream failures
Automated retention using ILM
The final architecture looked like this:
Configuration Decision #1: Avoid Elasticsearch TLS Misconfiguration
This was the first major issue and one of the easiest to misunderstand.
Elasticsearch 8.x enables TLS by default. Disabling TLS by editing elasticsearch.yml only tells half the story.
In practice, disabling TLS in Elasticsearch alone is not enough.
Issue
Elasticsearch remained stuck in 0/1 Running even after disabling TLS in the Elasticsearch configuration. The pod looked healthy at first glance, but readiness checks kept failing and the service never became available.
Root Cause
The problem was that TLS had only been disabled at the application layer.
A Helm chart typically has two separate configuration layers:
Chart logic → shell scripts, generated certificates, init containers, readiness probes, startup behavior
Application configuration → the actual
elasticsearch.ymlconsumed by Elasticsearch
These layers are independent.
That distinction matters because disabling TLS in the application config does not automatically disable TLS-related behavior in the chart layer.
In this case, Elasticsearch had already switched to HTTP, but the Helm chart was still generating certificates and configuring HTTPS readiness probes.
Kubernetes health checks were hitting HTTPS endpoints while Elasticsearch was serving plain HTTP.
That mismatch kept the pod unhealthy.
Fix
TLS had to be disabled in both layers.
Chart Layer
protocol: http
createCert: false
Elasticsearch Configuration Layer
esConfig:
  elasticsearch.yml: |
    xpack.security.enabled: false
    xpack.security.enrollment.enabled: false
    xpack.security.http.ssl.enabled: false
    xpack.security.transport.ssl.enabled: false
Only after both layers were aligned did the readiness probe succeed and the pod become healthy.
How to Verify Before Deploying
This is where helm template becomes extremely useful.
helm template elasticsearch elastic/elasticsearch -f values.yaml -n logging
This renders the Kubernetes manifests without applying them to the cluster.
The first thing I check is the readiness probe.
If the rendered manifest still shows HTTPS, then TLS is still enabled somewhere in the chart logic—even if Elasticsearch config looks correct.
This small validation step saves a lot of debugging time later.
Why This Matters
This was the first reminder that Helm charts are much more than a configurable values.yaml.
A chart often contains logic that exists outside application configuration, and understanding that boundary is critical when debugging.
Key Insight: Thinking in terms of chart layer vs application layer makes deployment issues much easier to reason about.
Other Important Elasticsearch Decisions
Once TLS was sorted, the next decisions were around cluster sizing, storage, and resource tuning.
Replicas
The chart defaults to:
replicas: 2
For this PoC, I intentionally ran:
replicas: 1
minimumMasterNodes: 1
The goal here was validating the logging pipeline, not building a highly available Elasticsearch cluster.
For production, the standard recommendation is three nodes. That gives quorum, avoids split-brain issues, and improves fault tolerance.
Storage
Without explicitly setting storageClassName, EKS typically defaults to gp2.
That can introduce inconsistency across environments.
I prefer setting storage explicitly.
volumeClaimTemplate:
  accessModes: ["ReadWriteOnce"]
  storageClassName: gp3
  resources:
    requests:
      storage: 10Gi
This makes storage behavior predictable and easier to reason about.
Resource Limits and JVM Heap
JVM sizing is one of the easiest ways to accidentally break Elasticsearch.
Two rules matter:
Xmsmust equalXmxHeap should be roughly 50% of container memory
Example:
resources:
  requests:
    cpu: "500m"
    memory: "1Gi"
  limits:
    cpu: "1000m"
    memory: "1.5Gi"

esJavaOpts: "-Xms512m -Xmx512m"
Why 50%?
Because JVM heap is not the only memory Elasticsearch uses. There is also off-heap memory, JVM overhead, and native memory usage.
If heap is oversized, Kubernetes eventually OOMKills the pod.
Key Insight: Size JVM heap using container memory limits, not node memory.
Configuration Decision #2: Design for Failure, Not Happy Paths
Once Elasticsearch was stable, the next challenge was ensuring the logging pipeline could survive failure conditions.
This is where logging systems become interesting.
They usually work perfectly during happy-path testing. Logs flow, dashboards load, and everything looks healthy.
The real test comes later—when downstream systems slow down, nodes come under pressure, or traffic suddenly spikes.
That is where memory and buffering decisions matter.
Issue
Fluent Bit worked well during normal traffic, but its behavior under downstream failures was a concern.
What happens if:
Elasticsearch becomes temporarily unavailable?
S3 slows down or throttles uploads?
Log volume suddenly spikes?
Without proper controls, logs continue getting ingested while outputs struggle to keep up.
That creates a dangerous failure mode.
Root Cause
By default, Fluent Bit keeps buffering incoming records in memory while waiting for outputs to recover.
That sounds fine initially.
But if Elasticsearch remains unavailable for long enough, records accumulate faster than they can be flushed. Memory usage keeps growing until the pod hits its limit.
At that point Kubernetes intervenes and OOMKills the pod.
The logging pipeline doesn’t degrade gracefully—it crash loops.
Fix
The key setting here was Mem_Buf_Limit.
[INPUT]
    Name              tail
    Tag               kube.*
    Path              /var/log/containers/*.log
    Mem_Buf_Limit     50MB
This caps how much memory the input stage can consume for buffering.
Once that threshold is reached, Fluent Bit stops reading new logs temporarily instead of consuming unlimited memory.
In other words, it applies backpressure.
Why This Matters
This single setting completely changes failure behavior.
Without it, Fluent Bit crashes.
With it, Fluent Bit slows down and protects itself.
That is a major architectural difference.
Key Insight: Backpressure is almost always better than crash loops.
Configuration Decision #3: Design the Fluent Bit Pipeline Intentionally
With buffering under control, the next step was pipeline design.
This was the most important part of the stack because it determined:
What logs were collected
How they were enriched
How they were routed
Where they were stored
The Fluent Bit pipeline is conceptually simple:
INPUT → FILTER → OUTPUT
Every log line flows through these stages in order.
What matters is how each stage is configured.
INPUT: Collect Only What You Need
On EKS, container logs are written to:
/var/log/containers/
Fluent Bit tails these files directly from the node.
Example input configuration:
[INPUT]
    Name              tail
    Tag               kube.*
    Path              /var/log/containers/*.log
    Exclude_Path      /var/log/containers/*_kube-system_*.log
    multiline.parser  docker, cri
    DB                /var/log/flb_kube.db
    Mem_Buf_Limit     50MB
    Skip_Long_Lines   On
Issue
Initially, every log was being ingested—including noisy system logs.
That created unnecessary load and clutter.
Root Cause
Dropping logs later in the pipeline still consumes CPU, memory, and buffer capacity because the records have already been created.
Filtering late is expensive.
Fix
Exclude unwanted logs at the input stage itself.
Exclude_Path /var/log/containers/*_kube-system_*.log
This prevents unnecessary records from ever entering the pipeline.
[IMAGE PLACEHOLDER — Fluent Bit input flow diagram]
Why This Matters
Logs that never enter the pipeline consume no CPU, memory, or buffer space.
Early filtering is significantly cheaper than downstream filtering.
Another important setting here is:
DB /var/log/flb_kube.db
This persists file offsets.
If the Fluent Bit pod restarts, it resumes from the last known position instead of re-reading logs from the beginning.
That prevents duplicate ingestion after restarts.
FILTER: Enrich Logs with Context
Raw container logs are useful, but limited.
To make them searchable and meaningful, they need context.
That is where the Kubernetes filter comes in.
[FILTER]
    Name                kubernetes
    Match               kube.*
    Kube_Tag_Prefix     kube.var.log.containers.
    Merge_Log           On
    Merge_Log_Key       log_processed
    Labels              On
    Annotations         Off
This filter enriches each record with Kubernetes metadata such as:
Namespace
Pod name
Container name
Labels
That metadata becomes critical during debugging.
Why Merge_Log Matters
This setting becomes especially useful for structured application logs.
Suppose the application emits:
{"level":"error","message":"timeout"}
With:
Merge_Log On
Fluent Bit parses that JSON and exposes individual fields.
That means Kibana can query directly on:
log_processed.levellog_processed.message
instead of treating the entire log as a plain string.
This makes debugging dramatically easier.
Routing Logs with rewrite_tag
This was the most important design decision in the entire Fluent Bit pipeline.
The goal was clear:
Application teams should see only application logs. Platform teams should see infrastructure and system logs.
That required clean separation.
Issue
Without explicit routing, all logs land together.
That makes searches noisy and operational debugging harder.
Root Cause
The default pipeline routes everything through the same tag.
Without re-tagging, there is no clean separation between app logs and platform logs.
Fix
Use rewrite_tag.
[FILTER]
    Name                  rewrite_tag
    Match                 kube.*
    Rule                  $kubernetes['namespace_name'] ^(apps)$ app.$TAG false
    Emitter_Name          re_emitted_app
    Emitter_Mem_Buf_Limit 50MB
The most important part is the final parameter:
false
This tells Fluent Bit to re-tag matching records and remove them from the original tag.
That changes everything.
App namespace logs move from:
kube.*
to:
app.*
and no longer exist in both places.
Platform logs remain on:
kube.*
Why This Matters
After routing:
app.*contains only application logskube.*contains only platform logs
No duplication. No overlap.
This made index design much cleaner.

Key Insight: The
falseparameter inrewrite_tagis what makes clean routing possible.
OUTPUT: Hot Storage and Cold Storage
The final stage was output routing.
The architecture used two storage layers:
Elasticsearch for hot storage
S3 for cold archival
Each solved a different problem.
Elasticsearch Output
Application logs:
[OUTPUT]
    Name                es
    Match               app.*
    Logstash_Format     On
    Logstash_Prefix     logs-app
    Generate_ID         On
    Buffer_Size         False
Platform logs:
[OUTPUT]
    Name                es
    Match               kube.*
    Logstash_Format     On
    Logstash_Prefix     logs-platform
    Generate_ID         On
    Buffer_Size         False
This creates daily indices like:
logs-app-2026.07.04logs-platform-2026.07.04
Why Generate_ID Matters
This prevents duplicate documents during retries.
If Elasticsearch rejects a batch and Fluent Bit retries, the same document ID ensures duplicates are not created.
Why Buffer_Size False Matters
This is one of the least discussed but most useful settings.
Elasticsearch can return verbose error responses, especially during indexing failures.
The default response buffer is limited.
Large error responses get truncated.
That makes debugging painful because critical failure details disappear.
Buffer_Size False
removes that cap and ensures the full error response is available.
That significantly improved troubleshooting.
S3 Output
In parallel, all logs were also shipped to S3.
[OUTPUT]
    Name              s3
    Match             *
    bucket            your-bucket-name
    region            ap-south-1
    s3_key_format     /fluent-bit/%Y/%m/%d/$TAG[0]/%H-%M-%S
    total_file_size   50M
    upload_timeout    10m
Why This Matters
Elasticsearch and S3 are not competing storage systems.
They serve different purposes.
Elasticsearch is optimized for:
Search
Debugging
Incident response
S3 is optimized for:
Cheap storage
Archival
Long-term retention
Together they provide a balanced logging strategy.
Configuration Decision #4: Plan Index Lifecycle Early
Once logs were successfully flowing into Elasticsearch and S3, the next challenge was managing them over time.
Getting logs into Elasticsearch is only the beginning.
Without a retention strategy, indices grow indefinitely. Storage costs increase, cluster performance degrades, and operational overhead rises quickly.
This is why index lifecycle planning should happen early—not as an afterthought.
The Kibana Compatibility Issue
This was one of the more unexpected issues.
The stack used:
Kibana
7.17.3Elasticsearch
8.5.1
This version mismatch was intentional.
Kibana 8.x charts introduced a TLS certificate volume mount requirement that could not be cleanly disabled via Helm values for this setup. Kibana 7.17.3 worked reliably for the PoC without introducing TLS complexity.
The tradeoff was compatibility.
Issue
The logging pipeline worked and logs were visible, but parts of the Kibana UI failed.
Creating index templates from the UI produced:
Error loading templates
request [/_template] contains unrecognized parameter: [include_type_name]
Root Cause
The issue came from API incompatibility.
Kibana 7.x still uses legacy template APIs in some UI workflows and sends the include_type_name parameter.
Elasticsearch 8.x removed support for that parameter entirely.
So the problem was not with Elasticsearch, Fluent Bit, or the pipeline itself.
It was purely a UI compatibility issue.
Fix
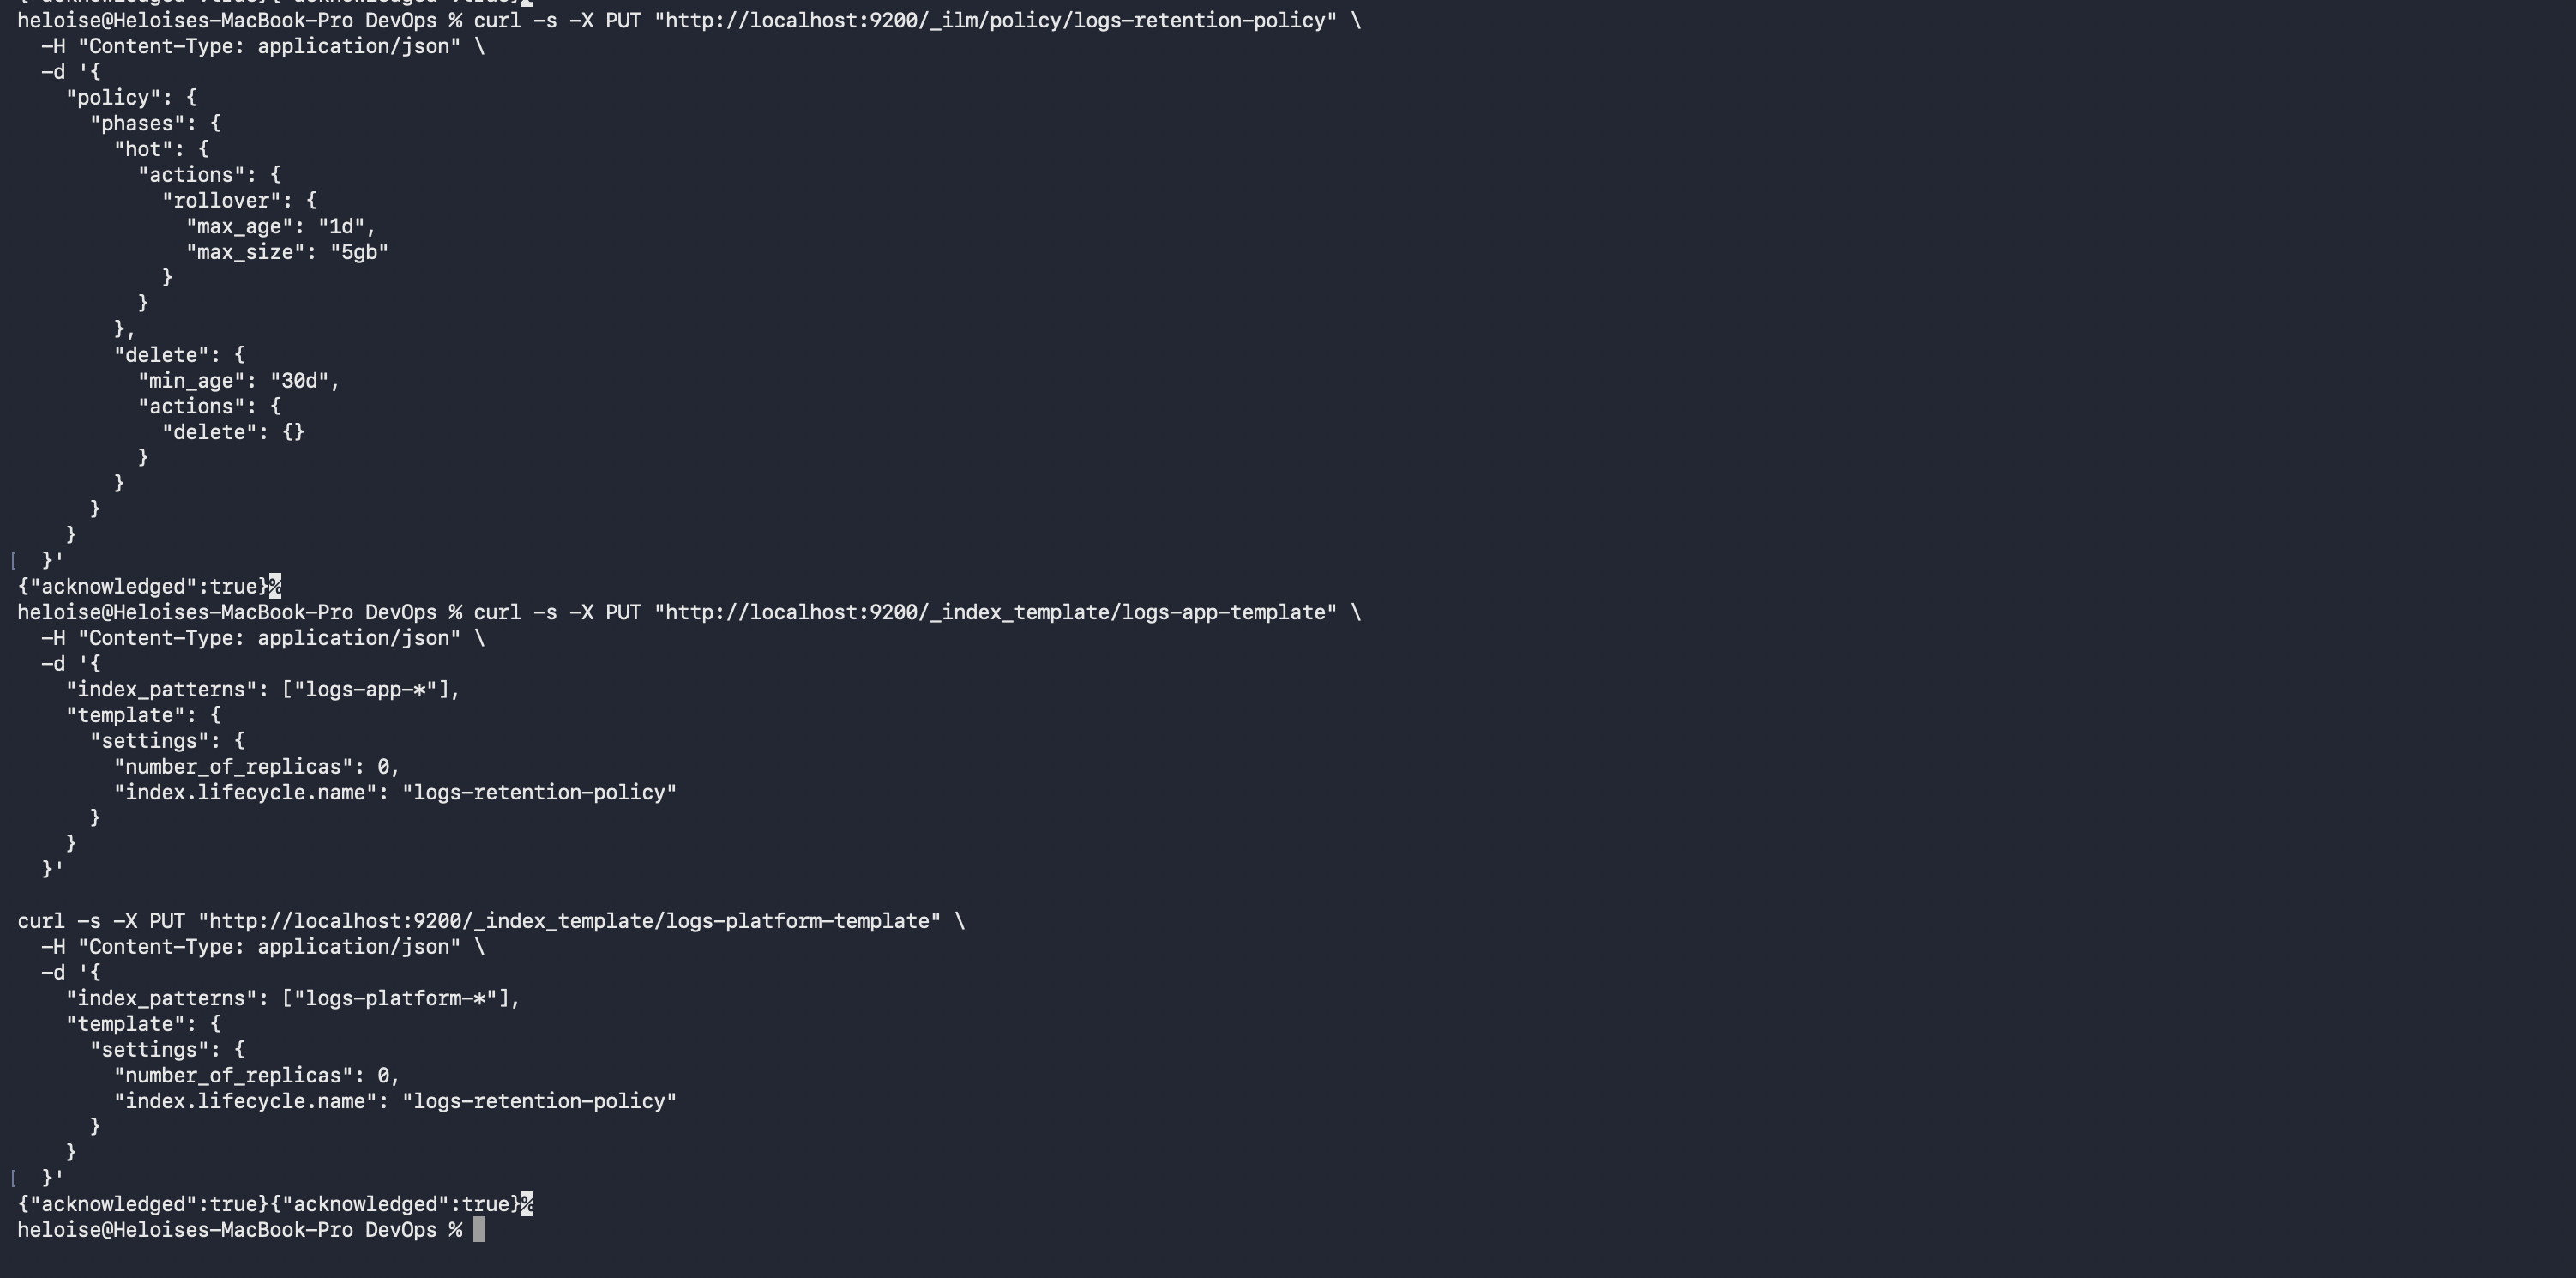
Instead of using the Kibana UI, index templates were created directly through the Elasticsearch API.
curl -s -X PUT "http://localhost:9200/_index_template/logs-app-template" \
  -H "Content-Type: application/json" \
  -d '{
    "index_patterns": ["logs-app-*"],
    "template": {
      "settings": {
        "number_of_replicas": 0,
        "index.lifecycle.name": "logs-retention-policy"
      }
    }
  }'
The important detail here is the API path.
Use:
/_index_template
not:
/_template
Elasticsearch 8.x uses composable index templates. The older endpoint still exists but is deprecated.
Once templates were created through the API, the compatibility issue stopped mattering.
Why This Matters
This is another example of a configuration boundary causing failure.
The logging pipeline was healthy. The Elasticsearch cluster was healthy. The issue existed only in the UI layer.
Key Insight: Understanding where a failure lives makes debugging significantly easier.
Fixing Yellow Cluster Health
After templates were created, another issue appeared.
Cluster health remained yellow.
Issue
Elasticsearch cluster health never became green even though logs were indexing correctly.
Root Cause
Replica shards.
This was a single-node cluster, but indices were still being created with:
number_of_replicas: 1
Elasticsearch was trying to allocate replica shards to a second node that did not exist.
That keeps cluster health permanently yellow.
A permanently yellow cluster is dangerous because it hides real issues. Yellow stops being a meaningful signal.
Fix
Set replicas to zero in the index template.
{
  "settings": {
    "number_of_replicas": 0
  }
}
This ensured all future indices inherited the correct configuration.
Existing indices still needed manual updates because templates only affect newly created indices.
Once replica counts were corrected, cluster health turned green.

Why This Matters
Cluster health signals should remain meaningful.
If your cluster is permanently yellow by design, you lose an important operational indicator.
ILM: Automating Retention
With indexing stable and cluster health corrected, the final step was retention.
This is where ILM becomes essential.
Issue
Without retention policies, Elasticsearch stores logs forever.
That is unsustainable.
Storage usage grows continuously, costs rise, and older indices consume resources long after they stop being useful.
Root Cause
Elasticsearch does not automatically expire data.
Even though Fluent Bit was creating daily indices using:
Logstash_Format On
those indices would remain indefinitely unless lifecycle policies were explicitly configured.
Fix
Define an ILM policy and attach it to index templates.
curl -s -X PUT "http://localhost:9200/_ilm/policy/logs-retention-policy" \
  -H "Content-Type: application/json" \
  -d '{
    "policy": {
      "phases": {
        "hot": {
          "actions": {
            "rollover": {
              "max_age": "1d",
              "max_size": "5gb"
            }
          }
        },
        "delete": {
          "min_age": "30d",
          "actions": {
            "delete": {}
          }
        }
      }
    }
  }'
This policy used two phases.
The hot phase handled active indices receiving writes. Indices rolled over after one day or after reaching 5 GB.
The delete phase removed indices 30 days after rollover.
That kept storage usage predictable and self-managing.
Why No Warm or Cold Phases?
This was a deliberate design decision.
Warm and cold phases involve moving shards across storage tiers or dedicated node groups.
That makes sense in larger production clusters.
For this setup, there was a single Elasticsearch node group running on a small cluster.
Adding warm or cold phases would only create allocation issues.
Instead, the long-term archival strategy relied on S3.
Elasticsearch handled hot searchable logs. S3 handled long-term retention.
That kept the architecture simple and cost-efficient.
Final Architecture
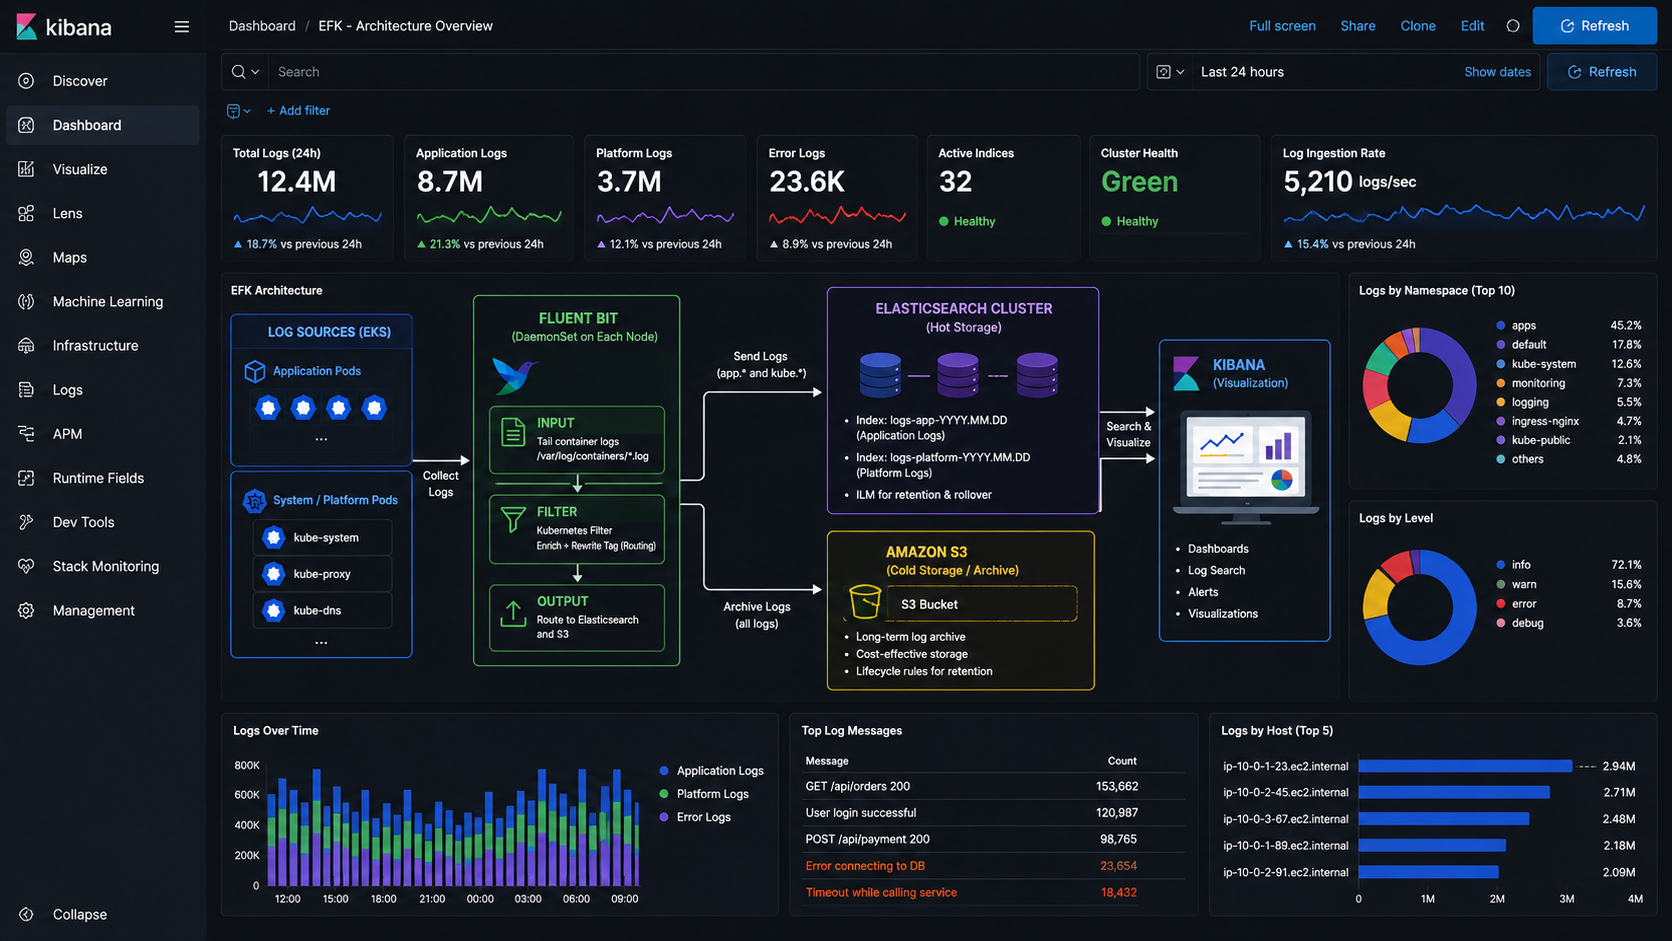
At the end of this, the stack looked like this:
Fluent Bit running on every node and collecting container logs
Kubernetes metadata enrichment for better observability
Application logs routed to
logs-app-*Platform logs routed to
logs-platform-*Elasticsearch serving as hot searchable storage
S3 acting as long-term cold archive
Index templates standardizing index behavior
ILM automatically managing retention
Architecture Lessons
Building this stack reinforced four important lessons.
1. Most failures happen at configuration boundaries
The tools usually work.
Failures often happen at integration points between systems.
2. Helm charts are more than configuration files
Chart logic matters just as much as application config.
Understanding both layers makes debugging easier.
3. Logging systems should degrade gracefully
Backpressure is better than crash loops.
Design for failure, not just normal traffic.
4. Retention strategy should be designed early
Storage, cost, searchability, and retention are architectural decisions—not implementation details.
If you're troubleshooting a broken EFK stack rather than building one from scratch, my previous article covers five real production failure modes and how I diagnosed them.
About the author
Exploring DevOps tools and practices.
Comments
Join the discussionNo comments yet. Be the first to comment.


